NYSE:WEEL
Peerless Option Income Wheel
The first-ever ETF that offers turnkey access to the popular Option Wheel investment strategy.
Investment Objective
The investment objective is to seek current income. The Peerless Option Income Wheel is an actively managed alternative income solution. Through a dynamic patent pending combination of secured put writing and covered-call writing, the investment objective of WEEL is to generate equity-like returns over the long term through income generation with less overall volatility than the major equity indexes.
Fund Documents
WEEL ETF Fund Summary
The WEEL ETF has engineered a strategic approach designed to deliver equity-like returns over the long term through income generation, while dampening volatility as compared with a traditional long only portfolio. Its aim is to achieve these returns independently of market index appreciation, combining the risk management benefits of buffer-style products with the income potential of a premium selling strategy.
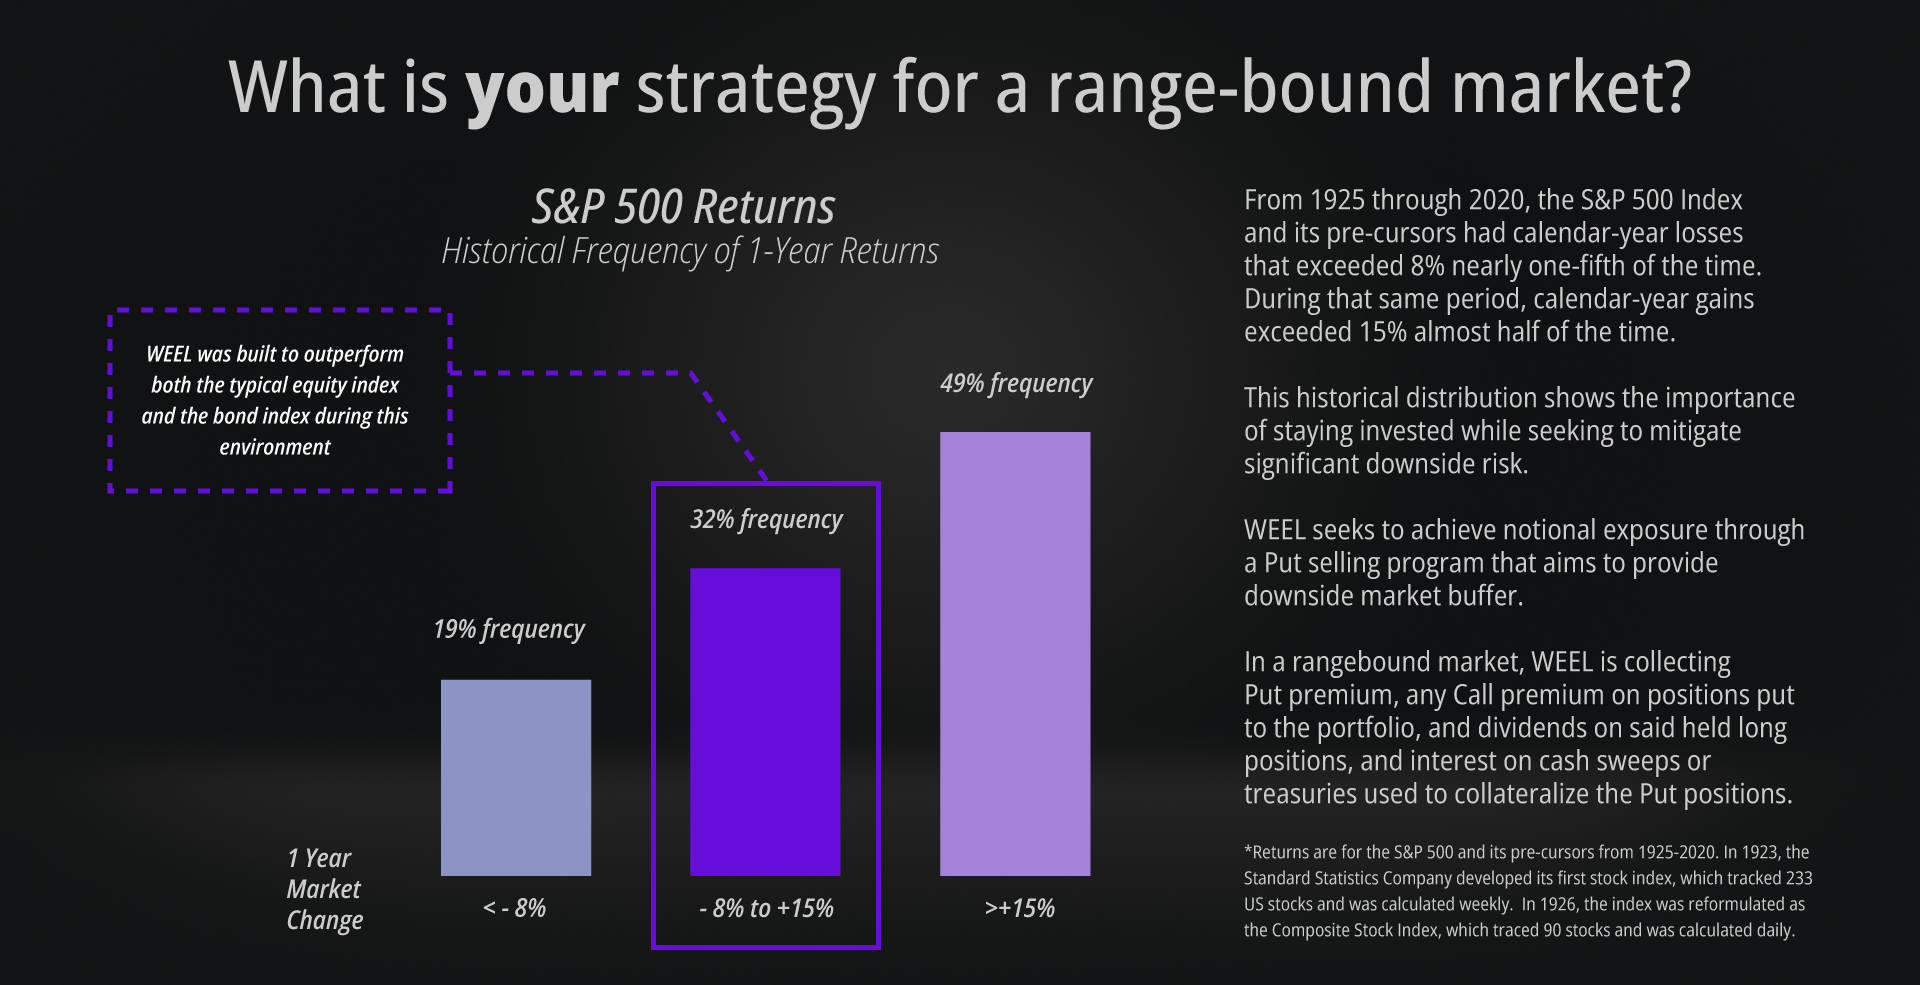
The fund adopts a disciplined, mechanical methodology that assists in buying low and selling high, while continuously collecting income with excellent capital efficiency. Abstaining from making market predictions, market timing, or favoring specific sectors are inherent features. It remains neutral in its approach to market trends, bullish or bearish sentiments, and value versus growth styles. It removes emotion, and provides a sustainable, risk-managed solution to create excess returns in range-bound markets.
Through our crafted process, we aim to simulate broad market exposure on a notional basis by means of cash (or treasury) secured puts. WEEL predominantly allocates across sector ETFs but can also utilize individual securities if these products do not provide the fund’s target achievement. All short put positions maintain a tight time frame, enabling frequent resets of the buffer to control downside risk. Any position that is ‘put’ to the portfolio becomes a long covered call contender, until that position itself is called away.
WEEL offers investors a sophisticated approach to achieving broad market exposure while effectively managing risk and providing income.
Please review the risks of the Fund below.
Strategy Overview
Watch Our Explainer Video

Jessica Inskip
Options Educator & Commentator; Co-Founder of the Market MakeHer Podcast
The Wheel In Motion
This patent-pending process is performed independently on a diversified basket of primarily sector ETFs. Each secured put is written out-of-the money, providing a buffer against potential losses while creating income. If assigned, covered calls are written on the position to create more income until it rebounds back. In bear markets, the majority (possibly all) of the positions will likely be assigned and the fund resembles a diversified equity allocation across sectors and market capitalization. This is an income strategy, and the vast majority (if not all) of the return will come from income generation rather than share price growth.

Peerless Wealth and Peerless ETFs
Peerless Wealth, LLC is an SEC-registered investment advisory firm and investment manager specializing in wealth and investment management for affluent clients. Founder Erik Thompson posits that a considerable number of individual investors, alongside numerous financial advisors, may not allocate sufficient focus towards planning for (and capitalizing on) markets characterized by stagnation, or bounded within a specific range. Over the last few years, he began running the option wheel income generation technique on an account-by-account basis and also in a private hedge fund. Performance solidified the technique and gave Peerless Wealth the confidence to roll it out to the public via an ETF. Peerless ETFs, a division of Peerless Wealth, LLC, offers the first and only SEC-registered 40-Act fund that utilizes the Option Wheel.

Erik Thompson
Peerless Wealth Founder
Co-Portfolio Manager

Robert Pascarella, PE
Research & Trading
Co-Portfolio Manager
Rob serves as an IAR at Peerless Wealth. An engineer by trade, he collaborated closely with Erik in the conceptualization and enhancement of their proprietary strategy. Notably, their innovative approach has garnered patent pending status with the US Patent and Trademark Office (USPTO). Leveraging further mathematical and data science background, Rob’s work extended to comprehensive backtesting, where the duo rigorously assessed the efficacy and robustness of their trading strategy across various market conditions. Through meticulous analysis of historical data and simulations, they refined the strategy to ensure its resilience and effectiveness in navigating dynamic market environments. This iterative process underscores their commitment to delivering a sophisticated and adaptive investment solution.
For more information about Peerless Wealth, LLC, please see www.peerless-wealth.com
“What is YOUR strategy for a range-bound market?”
Fund Details
Fund Details
| Fund Name | Peerless Option Income Wheel |
|---|---|
| Fund Inception | 5/16/2024 |
| Ticker | WEEL |
| Primary Exchange | NYSE |
| CUSIP | 88636J410 |
| Gross Expense Ratio | 1.25% |
| Management Fee | 1.09% |
| Expense Waiver** | -0.26% |
| Acquired Fund Fees And Expense*** | 0.16% |
| Net Expense Ratio | 0.99% |
| Distribution Rate | 11.86% |
| 30 Day SEC Yield* As of 10/31/2026 | 1.65% |
*The 30-Day SEC Yield is calculated with a standardized formula mandated by the SEC. The formula is based on the maximum offering price per share and does not reflect waivers in effect.
**The Adviser has contractually agreed to waive 0.25% of its management fees, through at least July 30, 2027.
***Acquired Fund Fees and Expenses (“AFFE”) are indirect fees and expenses the Fund incurs from investing in shares of other funds, including exchange-traded funds
Fund Data & Pricing
| Name | Value |
|---|---|
| Net Assets | $49.49m |
| NAV | $19.80 |
| Shares Outstanding | 2,500,000 |
| Premium/Discount Percentage | 0.04% |
| Closing Price | $19.80 |
| Median 30 Day Spread* | 0.30% |
| Name |
|---|
| 11/09/2026 |
**30-Day Median Spread is a calculation of Fund’s median bid-ask spread, expressed as a percentage rounded to the nearest hundredth, computed by: identifying the Fund’s national best bid and national best offer as of the end of each 10 second interval during each trading day of the last 30 calendar days; dividing the difference between each such bid and offer by the midpoint of the national best bid and national best offer; and identifying the median of those values.
The Distribution Rate is the annual rate an investor would receive if the most recently declared distribution remained the same going forward. The Distribution Rate is calculated by multiplying an ETF’s Distribution per Share by twelve (12) and dividing the resulting amount by the ETF’s most recent NAV. The Distribution Rate represents a single distribution from the ETF and does not represent its total return. Distributions are not guaranteed.
Performance
| Name |
|---|
| 10/31/2026 |
| Fund Name | Fund Ticker | 1 Month | 3 Month | 6 Month | YTD | 1 Year | 3 Year | 5 Year | 10 Year | Since Inception (Cumulative) | Since Inception (Annualized) | Date |
|---|---|---|---|---|---|---|---|---|---|---|---|---|
| Peerless Option Income Wheel ETF | WEEL MKT | -1.31 | 0.48 | 2.46 | 6.73 | 9.16 | – | – | – | 29.95 | 11.22 | 10/31/2026 |
| Peerless Option Income Wheel ETF | WEEL NAV | -1.33 | 0.66 | 2.65 | 7.8 | 9.45 | – | – | – | 29.99 | 11.24 | 10/31/2026 |
| S&P 500 TR | SPTR2 | -0.87 | 1.48 | 5.73 | 11.77 | 12.11 | – | – | – | 47.23 | 17.01 | 10/31/2026 |
| Name |
|---|
| 9/30/2026 |
| Fund Name | Fund Ticker | 1 Month | 3 Month | 6 Month | YTD | 1 Year | 3 Year | 5 Year | 10 Year | Since Inception (Cumulative) | Since Inception (Annualized) | Date |
|---|---|---|---|---|---|---|---|---|---|---|---|---|
| Peerless Option Income Wheel ETF | WEEL MKT | -0.95 | 2.74 | 8.32 | 8.15 | 12.48 | – | – | – | 31.68 | 12.27 | 09/30/2026 |
| Peerless Option Income Wheel ETF | WEEL NAV | -0.70 | 2.79 | 8.41 | 9.25 | 12.83 | – | – | – | 31.74 | 12.29 | 09/30/2026 |
| S&P 500 TR | SPTR2 | -0.35 | 2.30 | 17.85 | 12.75 | 15.74 | – | – | – | 48.52 | 18.1 | 09/30/2026 |
The performance data quoted above represents past performance. Past performance does not guarantee future results. The investment return and principal value of an investment will fluctuate so that an investor’s shares, when sold or redeemed, may be worth more or less than their original cost and current performance may be lower or higher than the performance quoted above. Performance current to the most recent month-end can be obtained by calling (844) 408-8111.
Short term performance, in particular, is not a good indication of the fund’s future performance, and an investment should not be made based solely on historical returns. Returns beyond 1 year are annualized.
A fund’s NAV is the sum of all its assets less any liabilities, divided by the number of shares outstanding. The market price is the most recent price at which the fund was traded.
Distribution Detail
| Distribution Per Share | EX Date | Record Date | Payable Date |
|---|---|---|---|
| 0.60 | 09/24/2026 | 09/24/2026 | 09/25/2026 |
| 0.60 | 06/25/2026 | 06/25/2026 | 06/26/2026 |
| 0.60 | 03/26/2026 | 03/26/2026 | 03/27/2026 |
| 0.75 | 12/30/2025 | 12/30/2025 | 12/31/2025 |
| 0.60 | 09/25/2025 | 09/25/2025 | 09/26/2025 |
| 0.60 | 06/26/2025 | 06/26/2025 | 06/27/2025 |
| 0.60 | 03/27/2025 | 03/27/2025 | 03/28/2025 |
| 0.73 | 12/27/2024 | 12/27/2024 | 12/30/2024 |
| 0.60 | 09/25/2024 | 09/25/2024 | 09/26/2024 |
Top 10 Holdings
| Name |
|---|
| 11/10/2026 |
| Date | Account | StockTicker | Fund Ticker | CUSIP | Shares | Price | MarketValue | Weightings | NetAssets | SharesOutstanding | CreationUnits |
|---|---|---|---|---|---|---|---|---|---|---|---|
| 11/10/2026 | WEEL | 912797SU2 | United States Treasury Bill 11/27/2026 | 912797SU2 | 7,930,000 | 99.82 | 7,915,559.39 | 15.99 | 49,488,500 | 2,500,000 | 100 |
| 11/10/2026 | WEEL | Cash&Other | Cash & Other | Cash&Other | 5,935,250 | 1.00 | 5,935,249.90 | 11.99 | 49,488,500 | 2,500,000 | 100 |
| 11/10/2026 | WEEL | 912797UY1 | United States Treasury Bill 11/12/2026 | 912797UY1 | 4,925,000 | 99.98 | 4,923,956.29 | 9.95 | 49,488,500 | 2,500,000 | 100 |
| 11/10/2026 | WEEL | KRE | State Street SPDR S&P Regional Banking ETF | 78464A698 | 56,000 | 73.45 | 4,113,200.00 | 8.31 | 49,488,500 | 2,500,000 | 100 |
| 11/10/2026 | WEEL | ARKK | ARK Innovation ETF | 00214Q104 | 44,000 | 78.98 | 3,475,120.00 | 7.02 | 49,488,500 | 2,500,000 | 100 |
| 11/10/2026 | WEEL | QQQ | Invesco QQQ Trust Series 1 | 46090E103 | 4,200 | 679.35 | 2,853,270.00 | 5.77 | 49,488,500 | 2,500,000 | 100 |
| 11/10/2026 | WEEL | SMH | VanEck Semiconductor ETF | 92189F676 | 5,500 | 487.41 | 2,680,755.00 | 5.42 | 49,488,500 | 2,500,000 | 100 |
| 11/10/2026 | WEEL | XLI | State Street Industrial Select Sector SPDR ETF | 81369Y704 | 15,000 | 168.89 | 2,533,350.00 | 5.12 | 49,488,500 | 2,500,000 | 100 |
| 11/10/2026 | WEEL | KWEB | KraneShares CSI China Internet ETF | 500767306 | 94,000 | 24.31 | 2,285,140.00 | 4.62 | 49,488,500 | 2,500,000 | 100 |
| 11/10/2026 | WEEL | XLU | State Street Utilities Select Sector SPDR ETF | 81369Y886 | 42,000 | 43.79 | 1,839,180.00 | 3.72 | 49,488,500 | 2,500,000 | 100 |
| 11/10/2026 | WEEL | EEM | ISHARES MSCI EMERGING MARKETS INDEX FUND | 464287234 | 27,000 | 61.03 | 1,647,810.00 | 3.33 | 49,488,500 | 2,500,000 | 100 |
| 11/10/2026 | WEEL | IYR | iShares U.S. Real Estate ETF | 464287739 | 15,000 | 103.18 | 1,547,700.00 | 3.13 | 49,488,500 | 2,500,000 | 100 |
| 11/10/2026 | WEEL | IGV | iShares Expanded Tech-Software Sector ETF | 464287515 | 15,000 | 101.46 | 1,521,900.00 | 3.08 | 49,488,500 | 2,500,000 | 100 |
| 11/10/2026 | WEEL | GDX | VanEck Gold Miners ETF/USA | 92189F106 | 15,500 | 91.46 | 1,417,630.00 | 2.86 | 49,488,500 | 2,500,000 | 100 |
| 11/10/2026 | WEEL | IWM | iShares Russell 2000 ETF | 464287655 | 4,300 | 282.51 | 1,214,793.00 | 2.45 | 49,488,500 | 2,500,000 | 100 |
| 11/10/2026 | WEEL | SLV | iShares Silver Trust | 46428Q109 | 18,000 | 48.14 | 866,520.00 | 1.75 | 49,488,500 | 2,500,000 | 100 |
| 11/10/2026 | WEEL | ASHR | Xtrackers Harvest CSI 300 China A-Shares ETF | 233051879 | 27,500 | 31.00 | 852,500.00 | 1.72 | 49,488,500 | 2,500,000 | 100 |
| 11/10/2026 | WEEL | ITB | ISHARES TRUST DJ HOME CONSTN | 464288752 | 8,500 | 99.45 | 845,325.00 | 1.71 | 49,488,500 | 2,500,000 | 100 |
| 11/10/2026 | WEEL | XLE | State Street Energy Select Sector SPDR ETF | 81369Y506 | 10,000 | 61.94 | 619,400.00 | 1.25 | 49,488,500 | 2,500,000 | 100 |
| 11/10/2026 | WEEL | FGXXX | First American Government Obligations Fund 12/01/2031 | 31846V336 | 296,005 | 100.00 | 296,005.19 | 0.60 | 49,488,500 | 2,500,000 | 100 |
| 11/10/2026 | WEEL | VXX | iPath Series B S&P 500 VIX Short-Term Futures ETN | 06748M196 | 8,000 | 19.02 | 152,160.00 | 0.31 | 49,488,500 | 2,500,000 | 100 |
| 11/10/2026 | WEEL | IAU | iShares Gold Trust | 464285204 | 800 | 77.78 | 62,224.00 | 0.13 | 49,488,500 | 2,500,000 | 100 |
| 11/10/2026 | WEEL | KRE 261113P00070500 | KRE US 11/13/26 P70.5 | KRE 261113P00070500 | -150 | 0.16 | -2,400.00 | 0.00 | 49,488,500 | 2,500,000 | 100 |
| 11/10/2026 | WEEL | IYR 261113P00099500 | IYR US 11/13/26 P99.5 | IYR 261113P00099500 | -30 | 0.50 | -1,500.00 | 0.00 | 49,488,500 | 2,500,000 | 100 |
| 11/10/2026 | WEEL | XLV 261113P00181000 | XLV US 11/13/26 P181 | XLV 261113P00181000 | -75 | 0.25 | -1,875.00 | 0.00 | 49,488,500 | 2,500,000 | 100 |
| 11/10/2026 | WEEL | XLE 261113P00059000 | XLE US 11/13/26 P59 | XLE 261113P00059000 | -90 | 0.11 | -990.00 | 0.00 | 49,488,500 | 2,500,000 | 100 |
| 11/10/2026 | WEEL | EEM 261113P00058000 | EEM US 11/13/26 P58 | EEM 261113P00058000 | -50 | 0.17 | -825.00 | 0.00 | 49,488,500 | 2,500,000 | 100 |
| 11/10/2026 | WEEL | XLU 261113C00045500 | XLU US 11/13/26 C45.5 | XLU 261113C00045500 | -420 | 0.02 | -840.00 | 0.00 | 49,488,500 | 2,500,000 | 100 |
| 11/10/2026 | WEEL | IAU 261113P00076500 | IAU US 11/13/26 P76.5 | IAU 261113P00076500 | -4 | 0.35 | -140.00 | 0.00 | 49,488,500 | 2,500,000 | 100 |
| 11/10/2026 | WEEL | XLU 261113P00042500 | XLU US 11/13/26 P42.5 | XLU 261113P00042500 | -180 | 0.07 | -1,260.00 | 0.00 | 49,488,500 | 2,500,000 | 100 |
| 11/10/2026 | WEEL | KWEB 261113P00023500 | KWEB US 11/13/26 P23.5 | KWEB 261113P00023500 | -200 | 0.08 | -1,500.00 | 0.00 | 49,488,500 | 2,500,000 | 100 |
| 11/10/2026 | WEEL | ITB 261120P00081000 | ITB US 11/20/26 P81 | ITB 261120P00081000 | -50 | 0.30 | -1,500.00 | 0.00 | 49,488,500 | 2,500,000 | 100 |
| 11/10/2026 | WEEL | QQQ 261113P00640000 | QQQ US 11/13/26 P640 | QQQ 261113P00640000 | -10 | 0.91 | -905.00 | 0.00 | 49,488,500 | 2,500,000 | 100 |
| 11/10/2026 | WEEL | KWEB 261113C00025500 | KWEB US 11/13/26 C25.5 | KWEB 261113C00025500 | -324 | 0.03 | -810.00 | 0.00 | 49,488,500 | 2,500,000 | 100 |
| 11/10/2026 | WEEL | VXX 261120C00031000 | VXX US 11/20/26 C31 | VXX 261120C00031000 | -80 | 0.25 | -1,960.00 | 0.00 | 49,488,500 | 2,500,000 | 100 |
| 11/10/2026 | WEEL | IWM 261111P00277000 | IWM US 11/11/26 P277 | IWM 261111P00277000 | -65 | 0.49 | -3,185.00 | -0.01 | 49,488,500 | 2,500,000 | 100 |
| 11/10/2026 | WEEL | IWM 261113P00270000 | IWM US 11/13/26 P270 | IWM 261113P00270000 | -110 | 0.26 | -2,860.00 | -0.01 | 49,488,500 | 2,500,000 | 100 |
| 11/10/2026 | WEEL | IWM 261120C00289000 | IWM US 11/20/26 C289 | IWM 261120C00289000 | -43 | 1.32 | -5,654.50 | -0.01 | 49,488,500 | 2,500,000 | 100 |
| 11/10/2026 | WEEL | GDX 261113P00086000 | GDX US 11/13/26 P86 | GDX 261113P00086000 | -150 | 0.37 | -5,550.00 | -0.01 | 49,488,500 | 2,500,000 | 100 |
| 11/10/2026 | WEEL | XBI 261113P00148000 | XBI US 11/13/26 P148 | XBI 261113P00148000 | -165 | 0.26 | -4,290.00 | -0.01 | 49,488,500 | 2,500,000 | 100 |
| 11/10/2026 | WEEL | IGV 261113C00105000 | IGV US 11/13/26 C105 | IGV 261113C00105000 | -150 | 0.41 | -6,075.00 | -0.01 | 49,488,500 | 2,500,000 | 100 |
| 11/10/2026 | WEEL | ASHR 261113C00031500 | ASHR US 11/13/26 C31.5 | ASHR 261113C00031500 | -200 | 0.14 | -2,700.00 | -0.01 | 49,488,500 | 2,500,000 | 100 |
| 11/10/2026 | WEEL | OIH 261120P00350000 | OIH US 11/20/26 P350 | OIH 261120P00350000 | -18 | 4.70 | -8,460.00 | -0.02 | 49,488,500 | 2,500,000 | 100 |
| 11/10/2026 | WEEL | KRE 261113C00076500 | KRE US 11/13/26 C76.5 | KRE 261113C00076500 | -560 | 0.19 | -10,360.00 | -0.02 | 49,488,500 | 2,500,000 | 100 |
| 11/10/2026 | WEEL | XLI 261113C00169000 | XLI US 11/13/26 C169 | XLI 261113C00169000 | -50 | 2.50 | -12,500.00 | -0.03 | 49,488,500 | 2,500,000 | 100 |
| 11/10/2026 | WEEL | SMH 261113C00485000 | SMH US 11/13/26 C485 | SMH 261113C00485000 | -10 | 13.08 | -13,075.00 | -0.03 | 49,488,500 | 2,500,000 | 100 |
| 11/10/2026 | WEEL | XRT 261113P00088000 | XRT US 11/13/26 P88 | XRT 261113P00088000 | -210 | 1.23 | -25,830.00 | -0.05 | 49,488,500 | 2,500,000 | 100 |
| 11/10/2026 | WEEL | IYR 261113C00103000 | IYR US 11/13/26 C103 | IYR 261113C00103000 | -150 | 2.45 | -36,750.00 | -0.07 | 49,488,500 | 2,500,000 | 100 |
Purchase
Peerless Option Income Wheel ETF (NYSE:WEEL) is available through various channels including via phone (844) 408-8111, broker-dealers, investment advisers, and other financial services firms, including: